How do I Analyze Historical Failure Data?
The Weibull Analysis module of Availability Workbench analyses historical failure and repair data by assigning probability distributions which represent the failure or repair characteristics of a given failure mode.
The failure distribution assigned to a given set of times to failure (known as a Weibull set) may be assigned to locations in the RCMCost location hierarchy or failure models in the AvSim module.
The Weibull Analysis Module analyses times-to-failure and time-to-repair data using the following distributions:
- Exponential Distribution
- 1-Parameter Weibull Distribution
- 2-Parameter Weibull Distribution
- 3-Parameter Weibull Distribution
- Bi-Weibull
- Tri-Weibull
- Lognormal Distribution
- Normal Distribution
- Weibayes
- Phased Bi-Weibull
- Phased Tri-Weibull
Displaying Data in Graphs and Reports
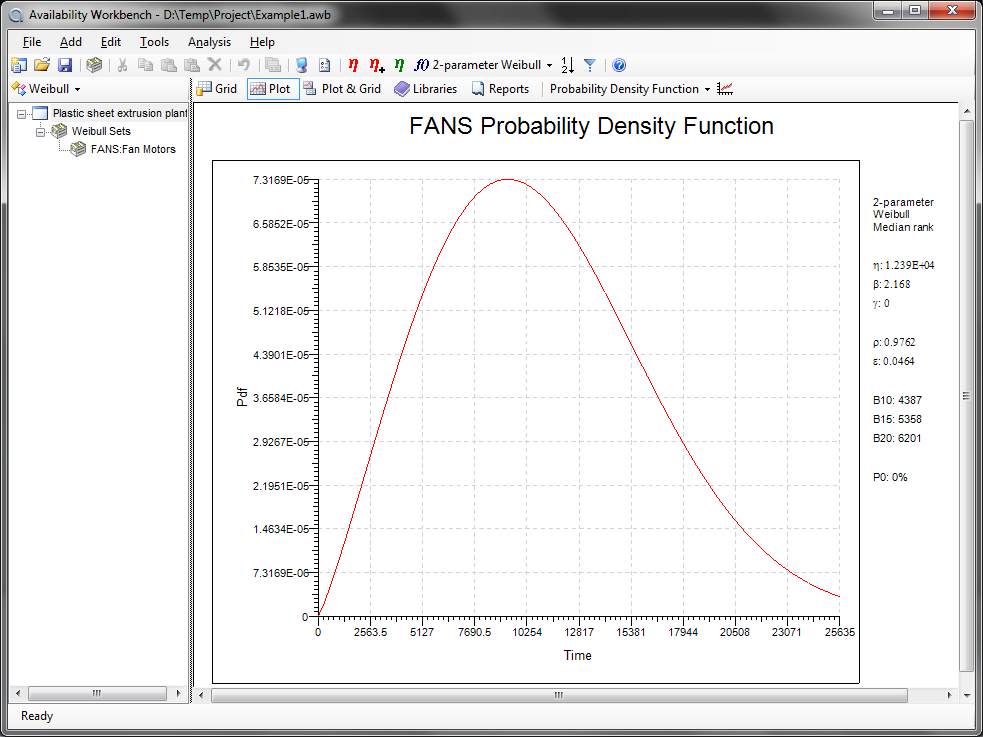
The Weibull module automatically fits the selected distribution to the data provided and displays the results graphically in the form of cumulative probability plots, unconditional probability density plots and conditional probability density plots. The plots may be viewed on the screen or printed to a report.
Data may be entered manually by the user or imported from other packages or transferred via the Windows clipboard using copy and paste. The Weibull Analysis module of AvSim+ has been designed to be extremely easy to use. For example new data can be analyzed in 4 simple steps:
- Enter or import the data
- Select a distribution type
- Instruct the Weibull module to analyze the data
- Print a report
Screenshots


